
Retirement annuities don’t want to be calculated
Retirements make me so excited! I was so excited to share this article – I could hardly contain my excrement!
RA fact sheets obscure their results. They obscure their fact sheets.
I have been in the personal finance sphere for more than a year and even worked in the industry – yet I have difficulty making sense of their notes.
This makes me want to rip out someone’s aorta with a bic pen – people are willfully making things complicated for the normal guy on the street to obscure returns and fees.
This is why I am biased.
If you have no idea what an RA is, check out a post here on what it is and how it works.
Note I have used this cool calculator here to do the calculations.
Benchmark used – fees and inputs
I will be comparing a few funds according to what some of my followers have sent through to me. I am going to use the following data as my benchmark, hypothetically speaking:
- I will be investing R 50 000 once-off
- I will be investing R 1 000 per month
- I look at the returns for the last 5 years – I understand that past performance does not indicate future performance, but I do want to create a benchmark of sorts
- I will deduct the fees as per the emails to the companies and/or fact sheets information
- I am theoretically more than 10 years from retirement, so I will be going for an equity stake policy to maximise my returns.
- I will be working on annualised returns for the purpose of this exercise
I will be excluding the following for this test, but this is real and needs to be accounted for:
- buy/sell spreads, performance fees, switching fees, termination fees
- I am treating active and passive funds as one for this exercise – I know this is wrong, but I want to get an idea
Note that some companies will auto-assign a financial advisor to you. This will cause your financial returns to go down due to fees.
Assumptions and biases: includes and excludes
I know I will get quite some flack for this post, and thus would like to put disclaimers here: I cannot take the world into account with these calculations:
- I am biased but open to correction Please contact me via Twitter if you have any suggestions
- I have not included the tax on my African Bank calculation – in the 20th year, this should have an effect of R70k of taxable income, which also has a huge impact. You could just as easily invest this in a tax-free savings account and not pay any tax.
- The chart for the 20 years is for illustrative purposes only. I know that the funds offer higher returns for 20 years than 5 years, but did want to show if the last 5 years continue, what the results will be
- I have also not included advisor fees. This can vary between 0.5 – 4.5% of the entire fund value.
- I have calculated on a 5-year basis – the reason for this is that if the first 5 years of investment are flat, the compounding in later years will greatly be affected.
Comparing retirement annuities’ fees and returns
EDIT
10x responded and said that they will fix their fact sheet to reflect all costs involved. I still like the company 😉
10x High Equity RA
I have heard only good things from 10X – so here comes the RA test. Here’s a list of my issues and concerns:
Their fact sheet is confusing.
Their return is prior to their fees. Here’s the quote from their fact sheet:
10X Investments, Stats SA. Performance is before 10X’s fee but after all other expenses. All returns greater than 12 months are annualised.
In an email, they confirmed that the 0.9% (excl VAT) from their fact sheet is only their fee. It’s more like 1,18%. Here is a quote from their email to me:
The maximum fee charged by 10X is 0.90% ex-vat. However, this excludes some associated costs with running the portfolio including trading costs like brokerage and STT and the underling TER’s of the money market fund and offshore ETF’s.
Fact sheet: find it here.
The results
I have changed the calculations as follows to get a better idea of the fees:
- The returns worked out to 6.2% over 5 years
- I will modify this to 6.2 + 1.18 = 7.38 % to include the fees
- The fees total, according to their email is 1.18 %

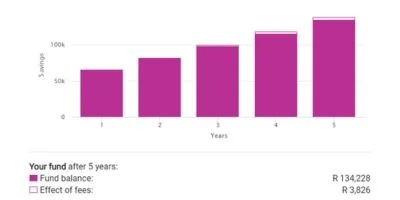
The Final numbers for the calculation:
Returns: 7.38%
Fees: 1.18%
See the chart below for the returns:
Emperors Balanced RA
On this one I am trusting EasyEquities – I don’t quite know if they have any other fees, but the facts sheet and their website state it’s 0.6 % (excl VAT) – which is highly irregular and quite surprising. It might be because this is a fairly new fund. Note that no advisor fees have been included here, as I am not able to get the information – it’s not readily available.
Note that the fact sheet did not explicitly say that the fees have been deducted from the strategy numbers. I have thus deducted them in my calculations.
The facts sheet is simulated – it’s not true data of the fund.
Fact sheet: find it here.
The results
The fund’s benchmark is CPI + 7%. I will use the data from their simulated fact sheet. I assume that the column ‘strategy’ is their return, as the “CPI + 7%” column seems like their benchmark.
The Final numbers for the calculation:
Returns: 6.34%
Fees: 0.75 % (incl VAT) See the chart below for the returns:
CORONATION BALANCED PLUS FUND A
I was impressed by the client service from Coronation – they explained their fees in plain English – something the fact sheet is not that clear about. This makes me a bit more comfortable with the company – though I am vehemently against RAs. They even made it clear I can invest directly through them and skip the advisor fee – my heart burns with love.
They use Total Investment Cost Ratio (TIC) as their indicator of costs, which even includes VAT! This makes my life so much easier.
Fact sheet: find it here.
The results
I have changed the calculations as follows to get a better idea of the fees:
- The returns worked out to 5.8% over 5 years
- I will modify this to 5.8 + 1.74 = 7.54 % to include the fees
- The fees total (TIC), according to the fact sheet is 1.74 %
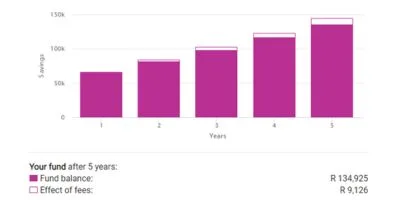
The Final numbers for the calculation:
Returns: 7.54%
Fees: 1.74 %
Liberty Single Manager High Equity Portfolio
Because I like risk and one of my Twitter followers sent me the start of their fees, I have decided to include a Liberty policy as well.
The Twitter follower paid 4.5 % of all contributions plus 1.92 % of the entire fund value as fees. Though I know this is biased, I want to illustrate what fees will do to you.
Fact sheet: find it here.
The results
Liberty is not very explicit on their fact sheet. The only thing you have to go by is this chart – they have no numbers and no fee breakdown. I have copied the chart directly from the fund sheet.
With a quick eyeball, you will see that your R 100 will be worth R 108 after 5 years.
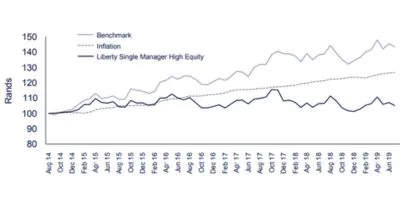
If you are interested in their other fact sheets, please check it out here – you will find that all high-risk investments underperform inflation. The low-risk funds are actually performing the best above inflation.
I hope this makes you happy!
I want to invest my money in cash rather
Well, yes. This is the obvious thing to do.
Compared to an RA, it’s a better investment leaving your money in cash or equivalents (check my article here if you have any questions on cash or equivalents as an asset class).
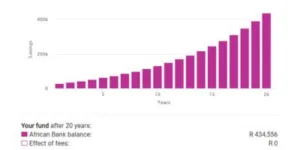
Over a term of 20 years, you will be earning more than double if you invested in an African Bank 60 months investment at their current rate of 10.75%.
Apologies for the R 2 effect on fees – it seems like the calculation engine rounds the money.
Note I have used Coronation in the below calculation and compared it to African Bank
Get money back from SARS
Well, yes. This is the obvious thing to do.
Note that you will then gain more interest, which is awesome. Compounding is the name of the game.
Let’s take a small scenario. I will assume:
- The parameters above for the R 1 000 and a R 50 000 lump sum.
- This person is not breaking the 27.5 % barrier and will get a full tax return on their money
- The income tax bracket for this person is 39 %. I will invest this yearly as when tax returns payout – R 4 680
Results of investing tax returns
So, after 20 years you will have R 598 623 from your RA. You would also have made R 434 556 from your African Bank investment. This means the total money you will have is:
R 598 623 + R 434 556 = R 1 024 179
This falls short of the R 1 170 215 you would have had for investing the same amount in a cash or equivalents over the long run at 10.75%.
Conclusion
I am sorry.
It’s been a long journey with calculations.
If you believe you have been scammed into a no-return fund policy, you will need to calculate what the impact will be in moving your RA to a company that is cheaper. You should also consult with your financial advisor and try to negotiate your fees – this is a major killer.
Please don’t do anything erratic and impulsively! Go and calculate the returns and the cost of moving. Speak to your financial advisor about the options you have.
Always scrutinise the fact sheets and make sure you understand the fees and risks involved.
I highly recommend looking into other options. On my blog, you will find many more options for other asset classes.
Explore then and check them out here!
Happy investing!